Selected Work in Progress:
“Post-Disasters Migration, Social Segregation, and Climate Justice: An Analysis of Residential Sorting Behavior”, with Huan Li
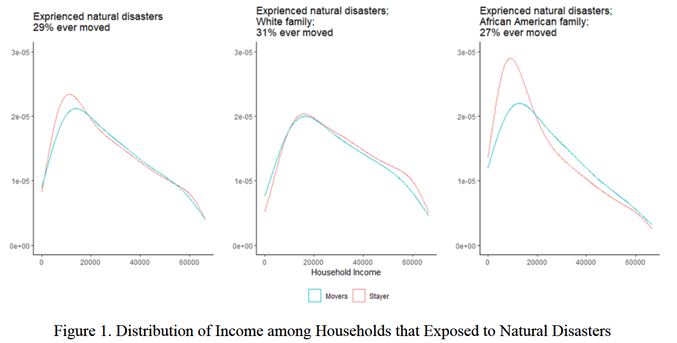
This paper studies the post-disaster migration and its implications on social equity by asking three questions: Do people migrate due natural disasters? Who migrate and who stay? What is the implication of post-disaster migration on the social segregation and climate injustice? To answer these questions, we examine the role of natural disasters in explaining residential location choice and migration behavior, as well as the potential disparities in the migration behavior across households of different socioeconomic groups. We develop a residential location choice model to describe post-disaster migration behavior, in which household’s preference on the amenities at residential location, i.e., natural disaster risk and resilience level, is influenced by their recent exposure to negative events, i.e., natural disasters.
We will also investigate whether, and if so, why do households with different socioeconomic backgrounds react to disasters differently. We hypothesize that, after exposed to natural disasters, wealthier and majority white households have a higher possibility to move to low-risk and high-resilience areas than poorer and minority households, because they are more willing and able to afford to. As an unintended consequence, social segregation could occur as privileged households migrate to safer areas, but unfortunately in the meanwhile, poorer and minority households are left behind in high-risk and low-resilience areas. If such post-disaster migration gap exists, then the impacts of natural disasters are likely to be linked to social segregation and may have long-term effects on social and climate inequity, just as mentioned in Zaveri et al. (2021): Migration shapes the lives of those who move and transforms the geographies and economies of their points of departure and destinations alike.
This project is grounded in theories in social psychology and economics. We combine structural model with reduced-form regression analyses to provide a comprehensive understanding of the impacts of natural disasters on households’ migration and social segregation in the US. We obtain the individual data from the PSID and the disaster events from FEMA Disaster Declarations Summaries. This database includes all official FEMA disaster declarations between 1953 and 2022. When it comes to measure households’ exposure to natural disasters, we consider their exposures within the past two years. This is following Deryugina et al. (2018) who finds that the migration rate increases within the two years after natural disasters and then returns to normal afterwards. In total, we obtain 57,709 individuals (58% white and 42% African American) over 38 years between 1973 and 2017.
“Direct and Indirect Effects of Voluntary Pollution Abatement Programs: An assessment of Ohio’s Tox Minus program”, with Michael Delgado, Neha Khanna and Georgie Stokol
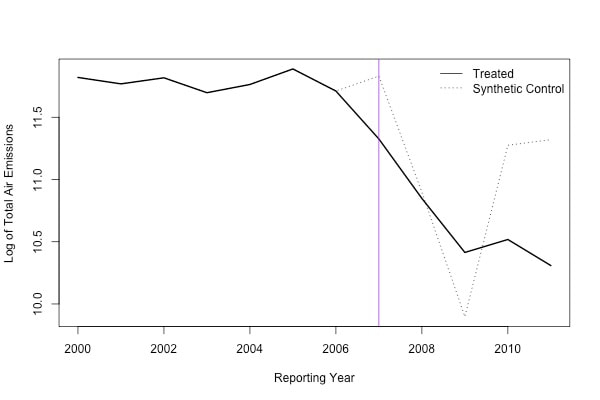
Figure: Preliminary result, treated line is the average of all participating plants, synthetic control line is the weighted average of all non-participating plants.
|
This paper is an immediate follow-up project of my job market paper, “Public Pressure and Heterogeneous Effects of Voluntary Pollution Abatement”. We apply the theory proposed in my job market paper on a very different regional voluntary regulation program in Ohio called “Tox-minus program”. We study the emission reduction heterogeneity and use synthetic control method to identify and evaluate the total program effect in plant emissions. According to the preliminary result without considering the emission reduction heterogeneity, it is not clear that “Tox-minus program” is effective in reducing plant emissions. Our next step is to explore the heterogeneity.
|
“NAAQS and the Composition of Ambient Fine Particulate Matter”, with Huan Li, Neha Khanna, and Jamie Hansen-Lewis
|
The purpose of this research is to identify an unintended consequence of the National Ambient Air Quality Standards (NAAQS) under the EPA’s Clean Air Act (CAA) through a novel lens focusing on chemical components of fine particulate matter (PM 2.5). The typical chemical components of airborne PM 2.5 are sulfate (SO4); nitrate (NO3); ammonium (NH4); black carbon; organic matter; mineral dust; and sea salt. Because the welfare gains from a reduction in PM 2.5 concentration depends on the specific change in chemical composition, through this study we show the necessity of refining the NAAQS standards further into chemical components and pollution sources.
There are two channels through which the NAAQS causes the chemical composition of PM 2.5 concentration to change. First, the NAAQS creates a threshold so that counties with very similar PM 2.5 concentration but that fall on either side of the threshold face very different intensity of regulation: counties designated as being in non-attainment face far more stringent regulation than attainment counties. This means that unlike attainment counties just below the threshold, non-attainment counties target the reduction of relatively low abatement cost components to fulfill their State Implementation Plans (SIP). We expect these reductions to cause differences in the chemical composition of PM 2.5 concentration for counties with very similar total concentrations. Second, as the NAAQS changed over time, a county may switch from PM 2.5 attainment to non-attainment due to the adoption of a more stringent standard. It is unknown whether the discrete change in the standard caused the components of PM 2.5 to decline proportionally or whether the reduction in PM 2.5 concentration engendered by the changes in the NAAQS caused a change in the chemical composition of PM 2.5. If it is the case that some components of PM 2.5 are more costly to abate, then PM 2.5 non-attainment counties may selectively reduce components of PM 2.5 to fulfill their SIP. |
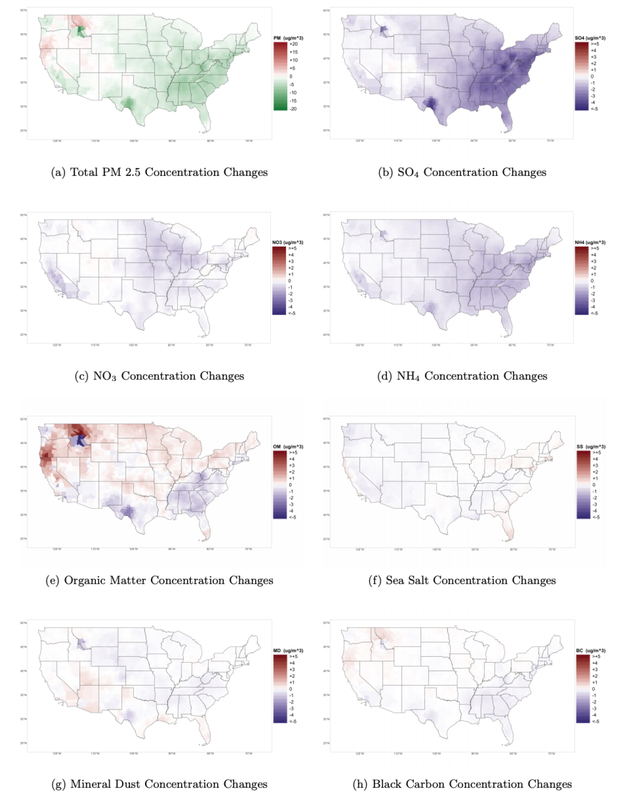
Figure: PM 2.5 composition changes by percentage at county level, year 2000 – 2017
|
“The Environmental Justice: An Intergenerational Perspective”, with Huan Li and Neha Khanna
In this project, we test whether and to what extent the disproportionate exposure to low environmental quality among socio-economically disadvantaged populations transmits from one generation to the next. It is important to consider intergenerational transmission in the context of environmental justice, as the literature has shown that in-utero and early childhood environmental exposure can partly explain adulthood socioeconomic status. Low adulthood income levels determine residential choices, and it has the unfortunate consequence of creating a multigenerational low environmental quality trap for less privileged families. Therefore, understanding intergenerational persistence in environmental exposure is essential to advance social equity and improve intergenerational mobility.
We create 4 samples of individual-grandparent pair using the restricted PSID data: (1) 9,023 individuals to 3,590 maternal grandmothers; (2) 8,358 individuals to 3,356 maternal grandfathers; (3) 7,170 individuals to 3,039 paternal grandmother; (4) 6,746 individuals to 2,866 paternal grandfathers. The restricted PSID data contains individual's own and family geospatial information, which is used to measure the individual air pollution exposure. In our preliminary analysis, we find consistent results using the four samples that, on average, the intergenerational correlation in pollution exposure is positive and significant. Nonetheless, while African American individuals continue to live in areas with significantly higher air pollution, the correlation with their grandparents’ exposure to PM2.5 is weaker than for white individuals’.
We create 4 samples of individual-grandparent pair using the restricted PSID data: (1) 9,023 individuals to 3,590 maternal grandmothers; (2) 8,358 individuals to 3,356 maternal grandfathers; (3) 7,170 individuals to 3,039 paternal grandmother; (4) 6,746 individuals to 2,866 paternal grandfathers. The restricted PSID data contains individual's own and family geospatial information, which is used to measure the individual air pollution exposure. In our preliminary analysis, we find consistent results using the four samples that, on average, the intergenerational correlation in pollution exposure is positive and significant. Nonetheless, while African American individuals continue to live in areas with significantly higher air pollution, the correlation with their grandparents’ exposure to PM2.5 is weaker than for white individuals’.
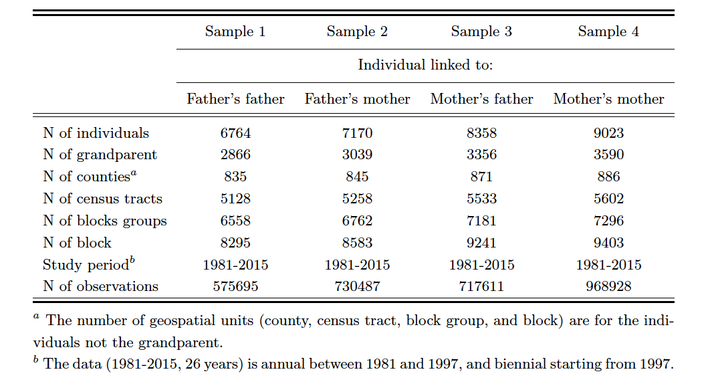
Table: Four multigenerational samples